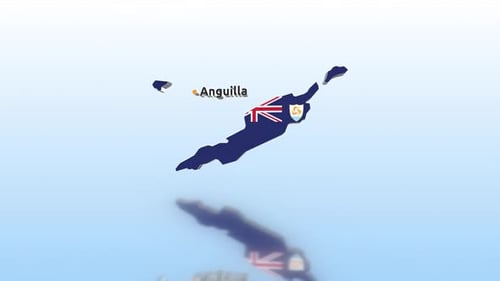
Anguilla Financial Data Bar Chart with Declining Trend
By moononOne great value subscription from €14.50/month
- Unlimited downloads of 27+ million creative assets
- AI Tools: video, image and more
- Lifetime commercial license
- Easy cancellation
Attributes
- Length
- 0:11
- Resolution
- 1920 x 1080
- File Size
- 512 MB
- Frame Rate
- 29.97 fps
- Alpha Channel
- No
- Looped
- No
- Video Encoding
- ProRes
- Orientation
- Horizontal
- Commercial License
- Further Information
Description
This animation presents a dynamic 3D bar graph depicting a decline in data, accompanied by a bright green arrow curving downwards to clearly illustrate a negative trend. Behind the quantitative visualization, a glossy, rectangular flag of Anguilla is prominently displayed. The entire scene is set against a subtle, gridded world map background, emphasizing a global or national context for the presented information. Soft lens flares and reflections enhance the professional and polished aesthetic. This visual asset is ideal for business presentations, economic reports, or news segments requiring a clear and engaging way to show decreasing financial figures, market downturns, or performance reductions in an infographic style.