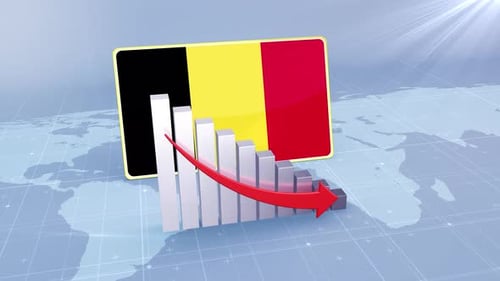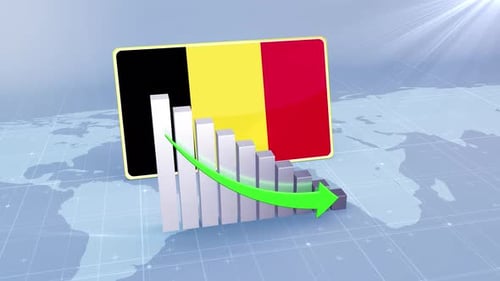
Animated 3D Bar Chart Showing Economic Decline with Belgium Flag
By moononOne great value subscription from €14.50/month
- Unlimited downloads of 27+ million creative assets
- AI Tools: video, image and more
- Lifetime commercial license
- Easy cancellation
- Length
- 0:11
- Resolution
- 1920 x 1080
- File Size
- 512 MB
- Frame Rate
- 29.97 fps
- Alpha Channel
- No
- Looped
- No
- Video Encoding
- ProRes
- Orientation
- Horizontal
- Commercial License
- Further Information
Description
This animated clip presents a dynamic 3D bar chart illustrating a significant economic decline, designed for compelling visual communication. The motion graphic features a series of clean, white bars that progressively decrease in height from left to right, clearly representing a falling trend over a period. A vibrant, glossy green arrow overlays the chart, smoothly tracing the downward trajectory and emphatically highlighting the negative performance. Positioned prominently behind the bar chart is a sleek, rectangular graphic of the Belgium flag, rendered with a reflective finish, which provides a specific national context to the economic data being presented. The background subtly displays a light blue world map grid, suggesting a global economic perspective and the interconnectedness of markets. This modern and professional animation is an ideal visual asset for enhancing financial reports, business presentations, economic news segments, market analysis videos, or any digital content requiring a clear and impactful representation of economic downturns or negative market performance, particularly in the context of Belgium. It efficiently communicates complex financial information in an easily understandable and engaging format, perfect for corporate and informational projects.