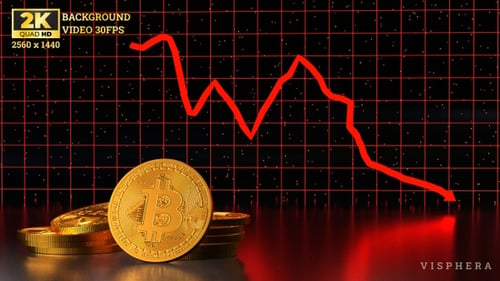
Bitcoin Price Drop Animation with Red Line Graph
By VispheraOne great value subscription from €14.50/month
- Unlimited downloads of 27+ million creative assets
- AI Tools: video, image and more
- Lifetime commercial license
- Easy cancellation
Attributes
- Length
- 0:06
- Resolution
- 2560 x 1440
- File Size
- 112 MB
- Frame Rate
- 30 fps
- Alpha Channel
- No
- Looped
- No
- Video Encoding
- H.264
- Orientation
- Horizontal
- Commercial License
- Further Information
Description
An animated visual depicts a fluctuating red line graph illustrating a market decline over time. Set against a dark, grid-patterned background with subtle starry accents, the graph dynamically moves downwards, symbolizing a price drop or economic downturn. In the foreground, several polished 3D rendered golden Bitcoin coins are stacked, reflecting the red glow from the graph. This polished animation is ideal for financial news, cryptocurrency analysis, business presentations, or any content requiring a clear and impactful representation of market volatility and decreasing asset value.